

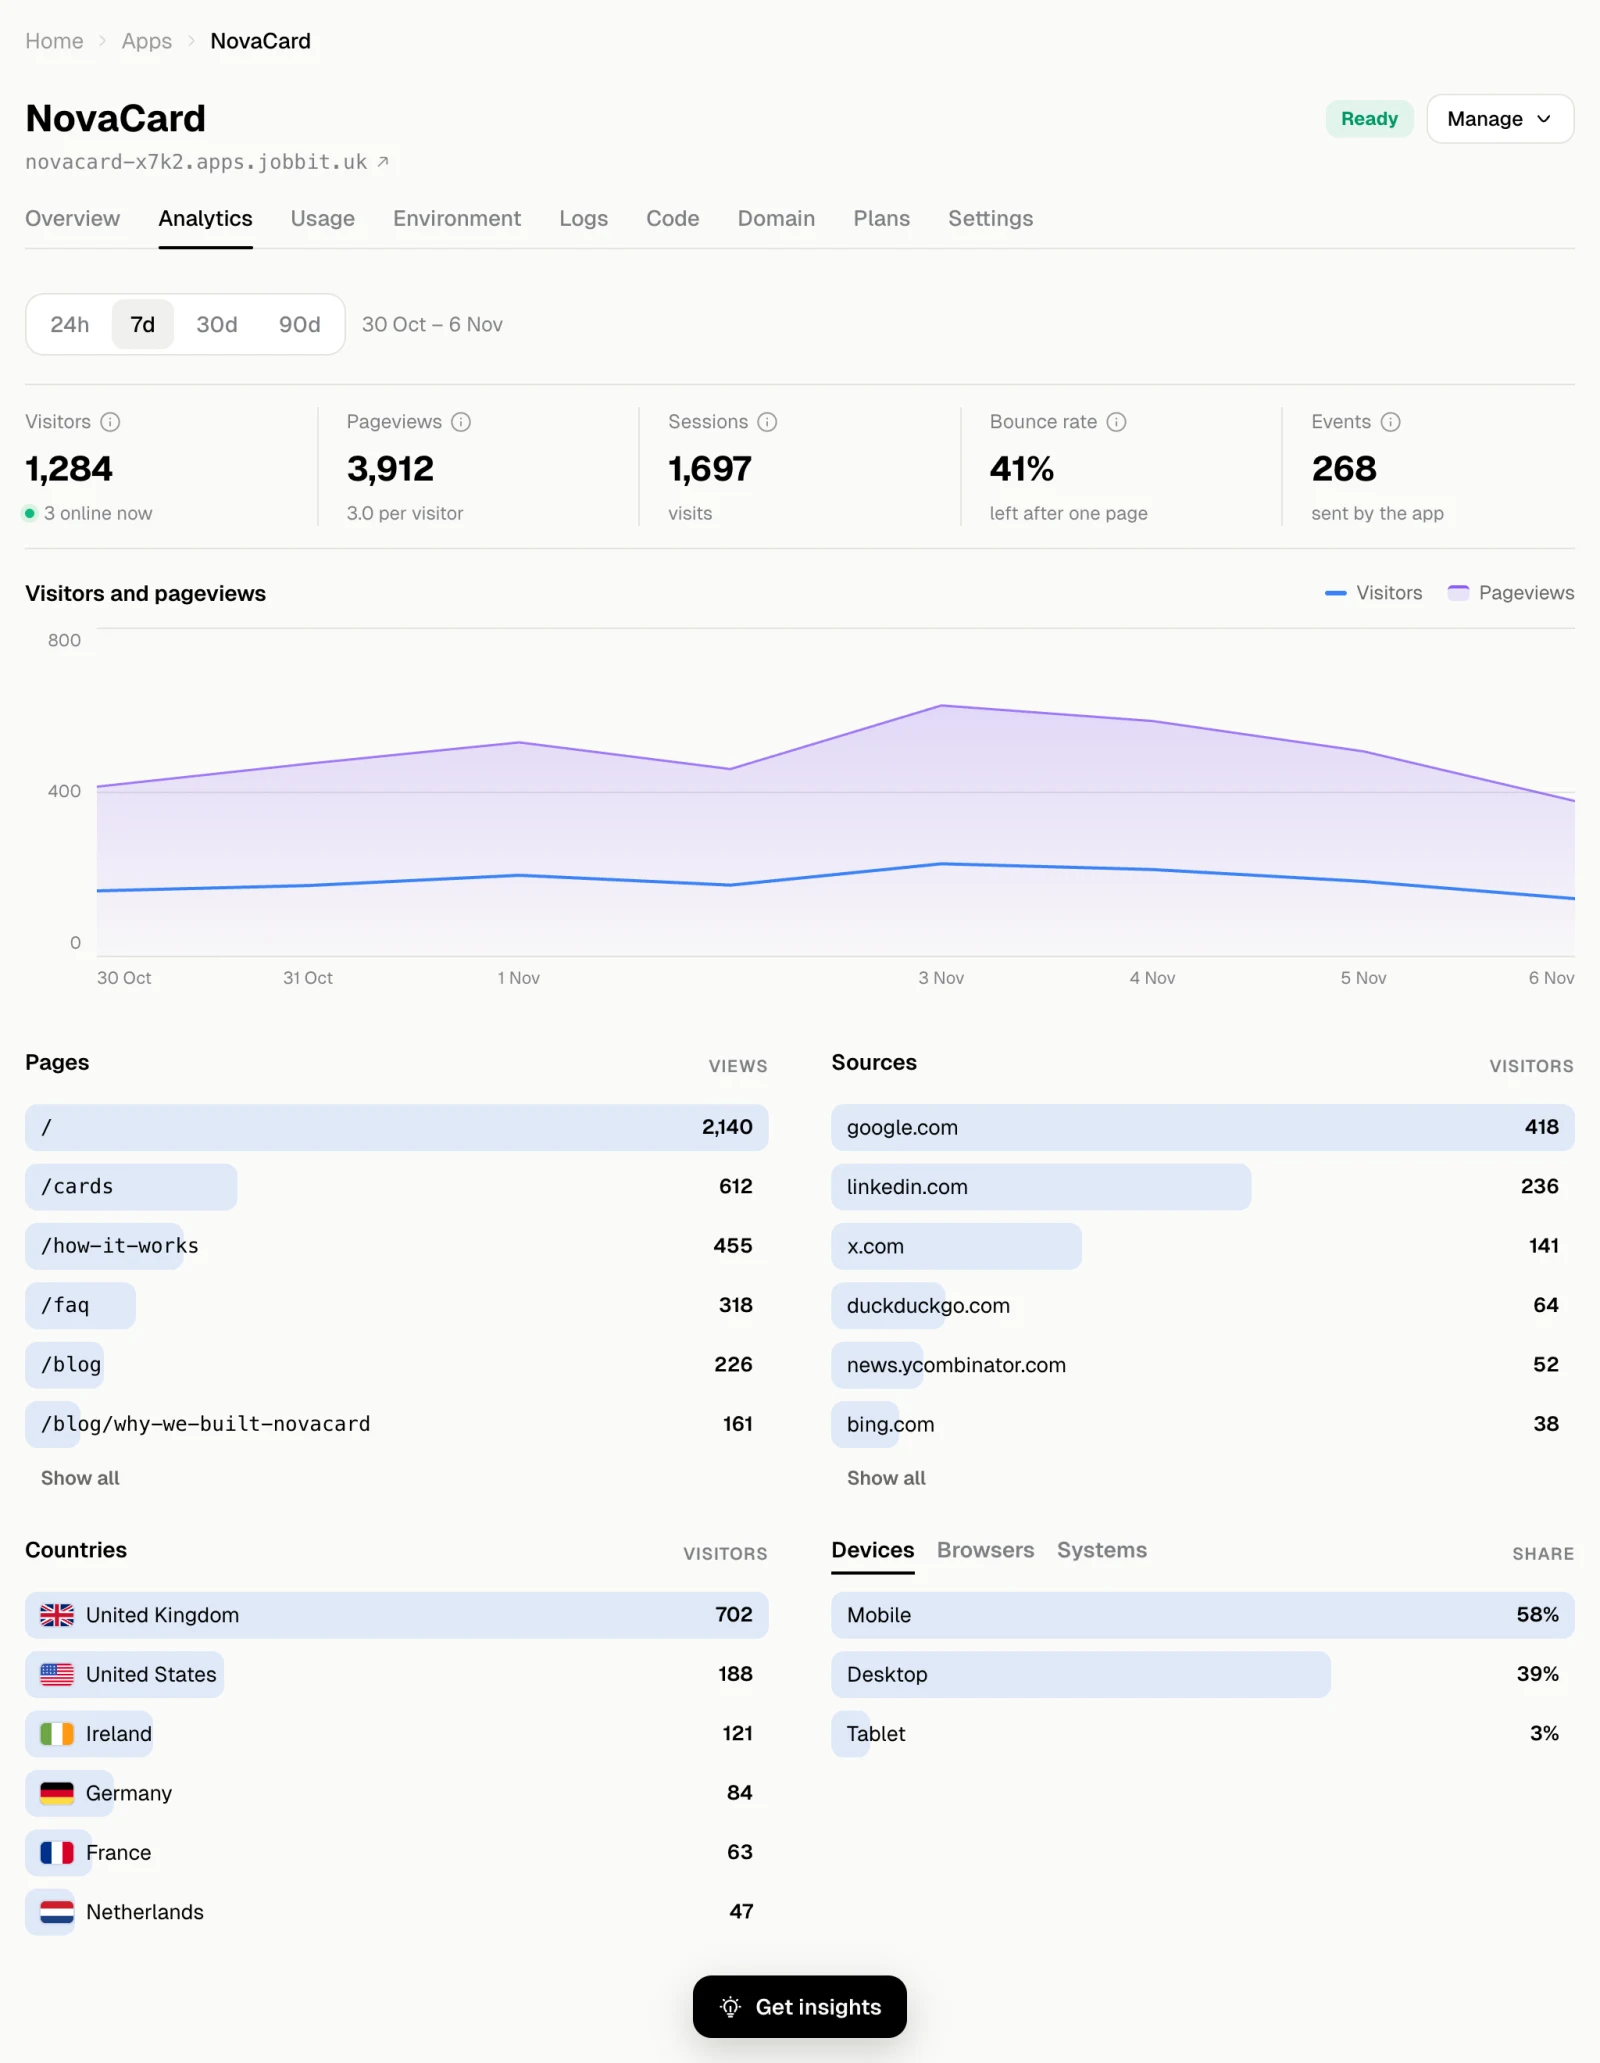
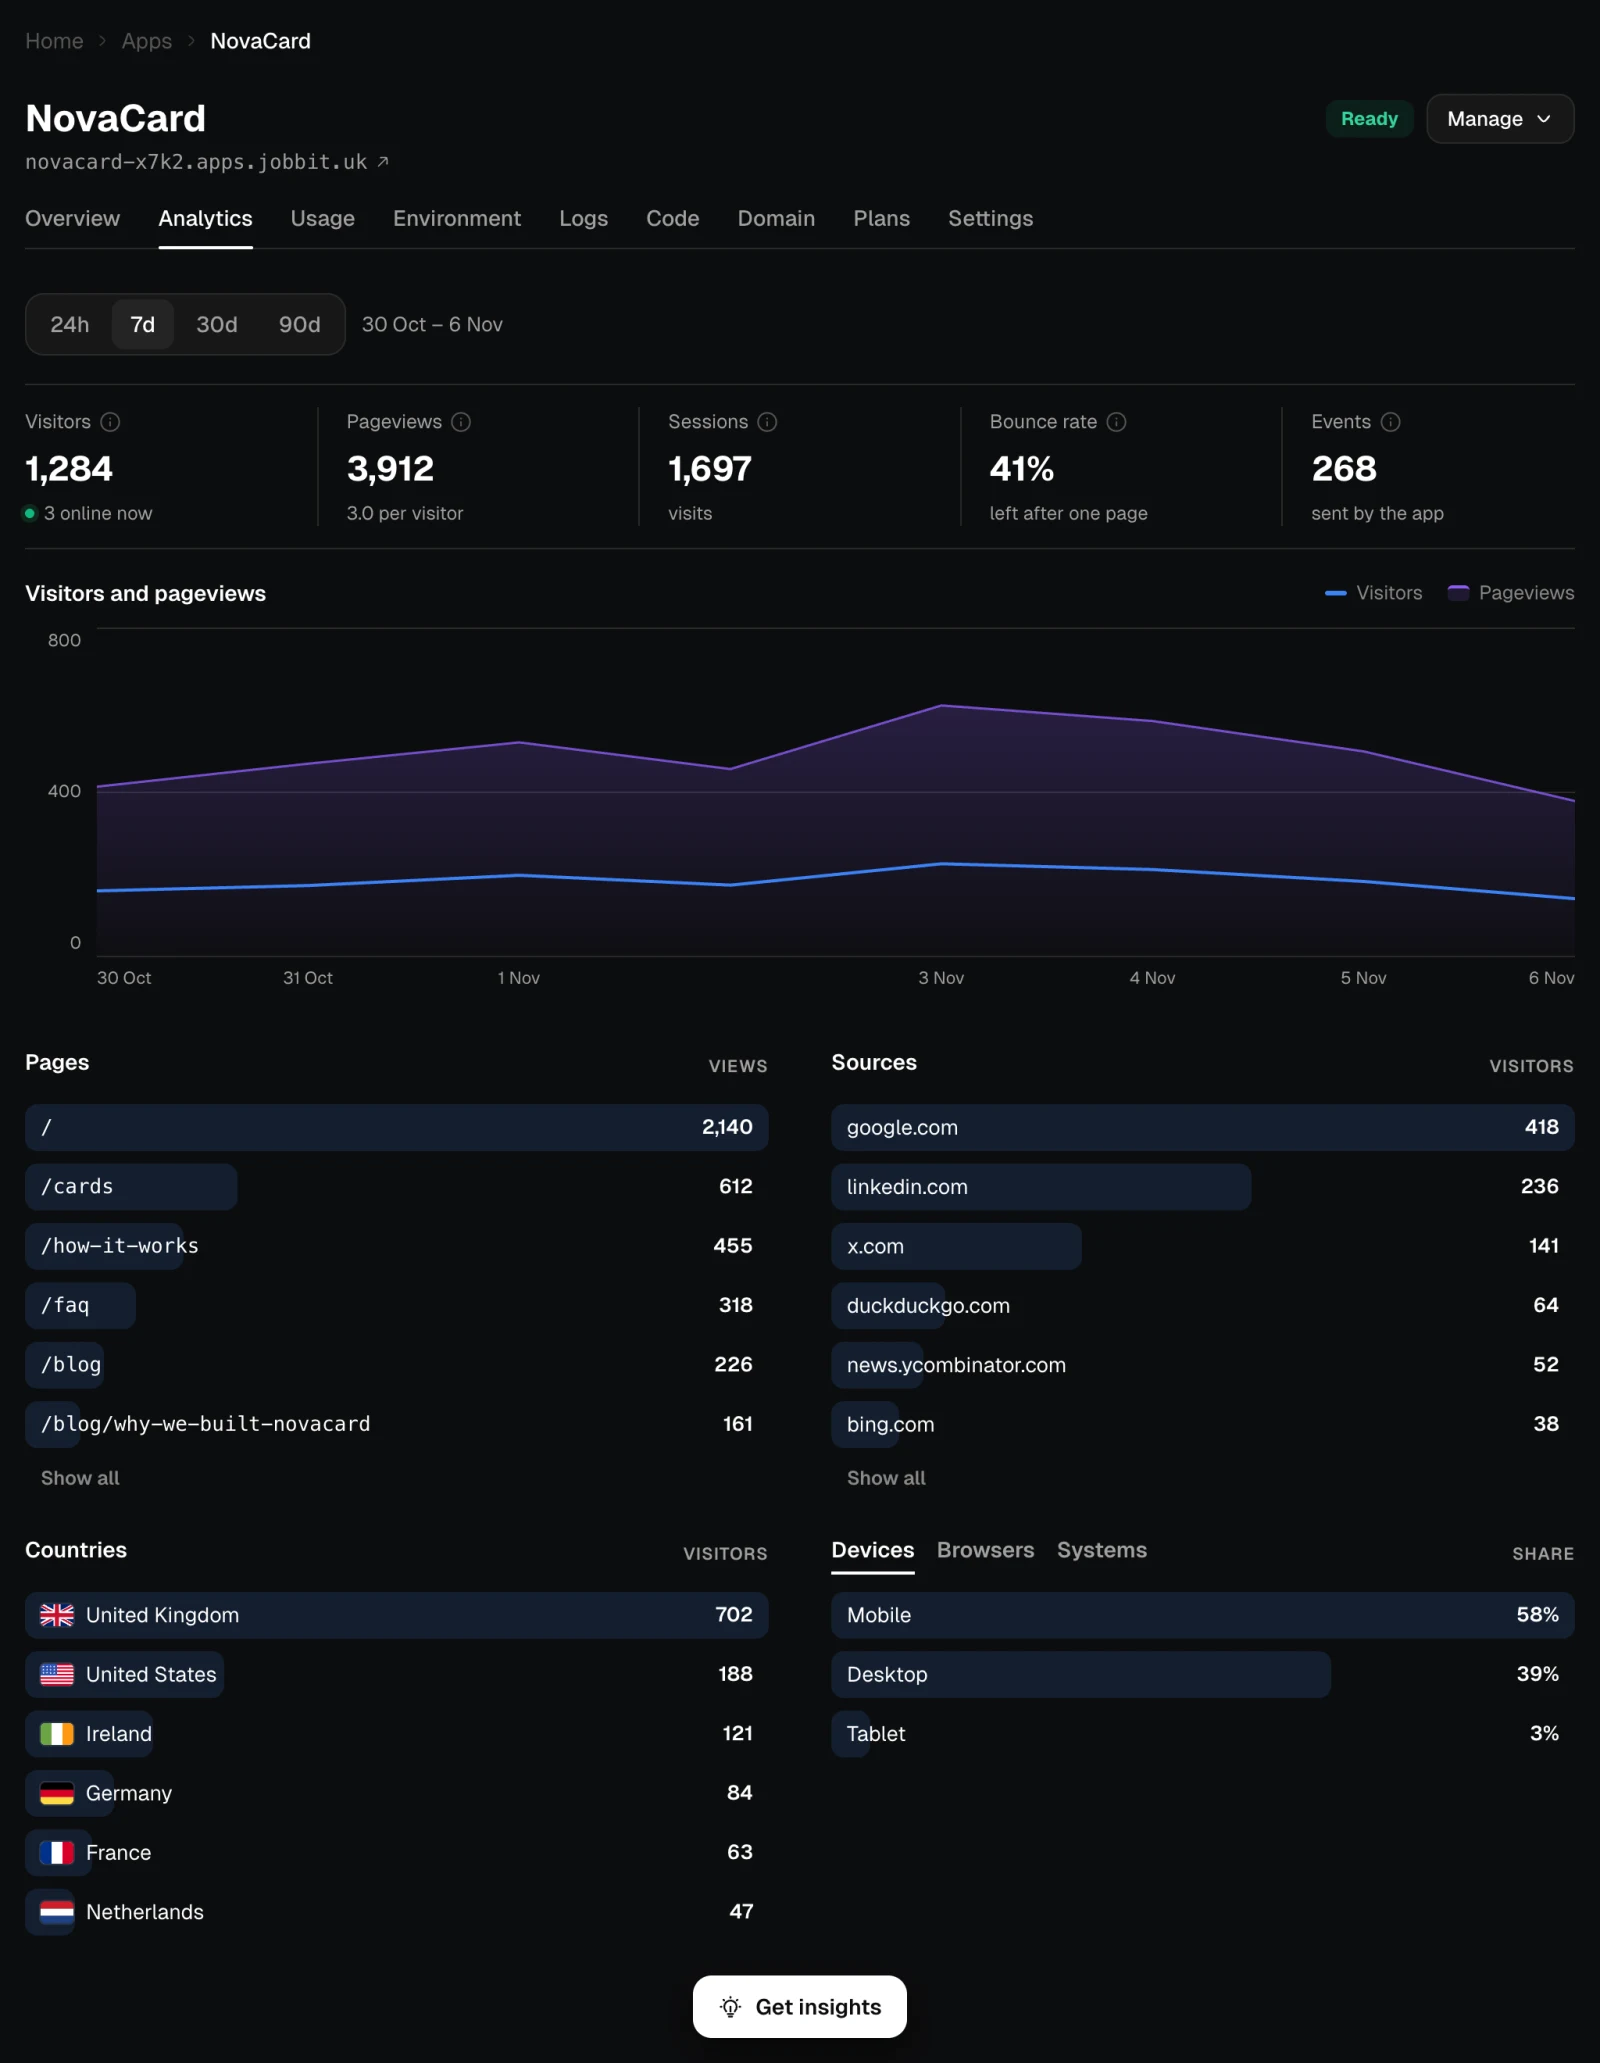
Figures
| Figure | Meaning |
|---|---|
| Visitors | People who opened the app in the period, each counted once. One browser on one device is one visitor, so a phone and a laptop count as two. Underneath, how many are online now (the last 5 minutes) |
| Pageviews | Every page opened, counting the same page each time, and how many pages one person opens on average |
| Sessions | Visits. A visit ends after 30 minutes with nothing done, so one person can make several in a day |
| Bounce rate | Visits that opened one page and left. Lower means people look further; on a one-page site it is always high |
| Events | Actions the app reports from its own code, such as a form sent or a sign-up |
Where visitors come from
- Pages: the most viewed pages.
- Sources: the sites that sent visitors, such as search engines and social networks.
- Countries: where visitors are.
- Devices, Browsers and Systems: what they use, as a share of all visitors.
Speed, errors and events
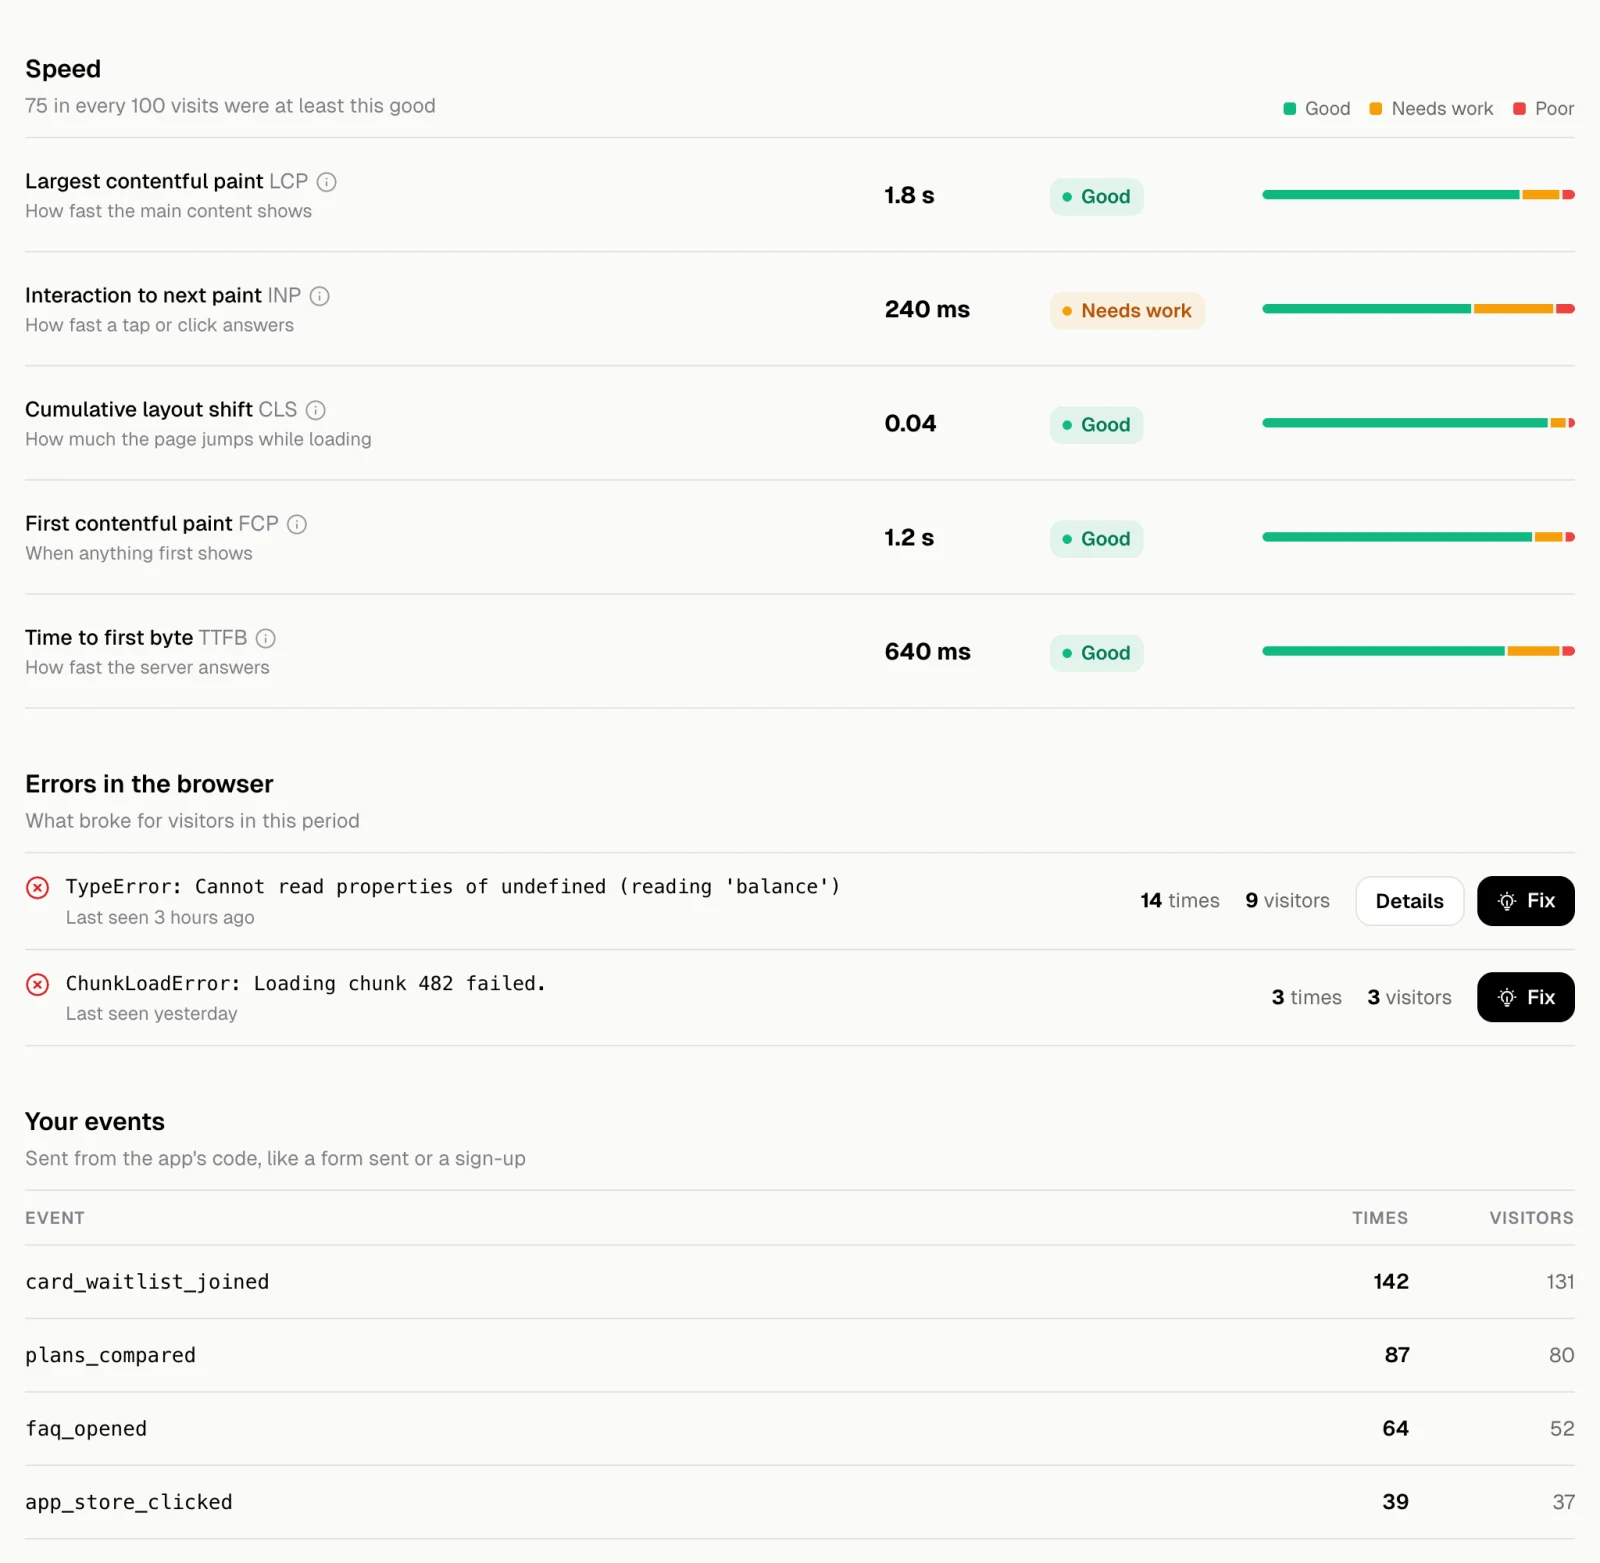
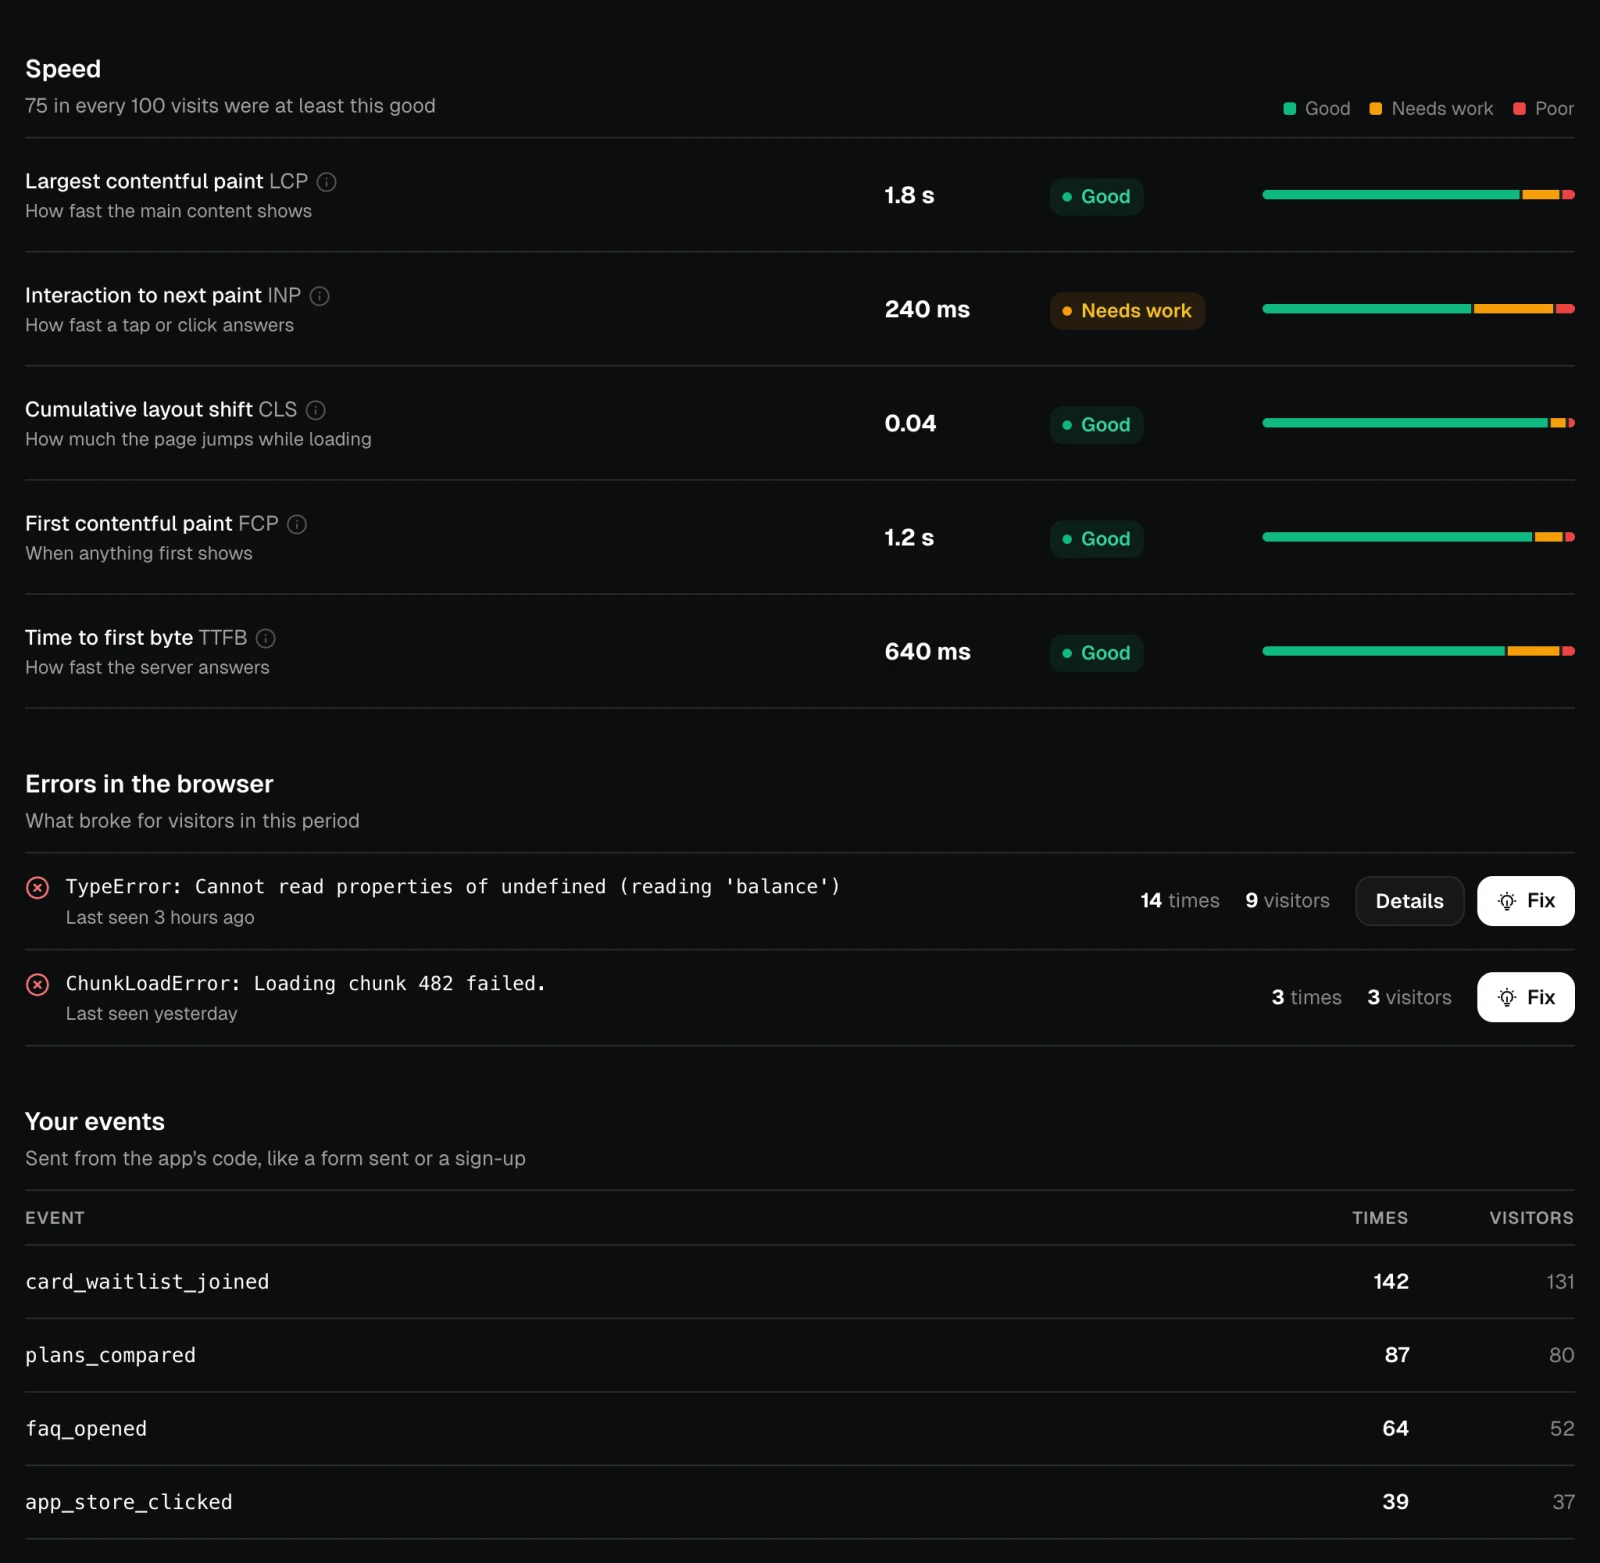
| Measure | What it is | Good up to | Poor above |
|---|---|---|---|
| Largest contentful paint (LCP) | How fast the main content shows | 2.5 s | 4 s |
| Interaction to next paint (INP) | How fast a tap or click answers | 200 ms | 500 ms |
| Cumulative layout shift (CLS) | How much the page jumps while loading | 0.1 | 0.25 |
| First contentful paint (FCP) | When anything first shows | 1.8 s | 3 s |
| Time to first byte (TTFB) | How fast the server answers | 800 ms | 1.8 s |